
This Cryptocurrency Skyrockets by 90 pc In the Last 30 Days- Check Details (image source: Canva)
Ondo Finance token ONDO has emerged as a standout performer in the volatile cryptocurrency market, experiencing a remarkable price surge of over 90 per cent in the last 30 days. Despite the recent crypto market crash, ONDO has defied the odds and showcased exceptional growth. As investors gear up for the upcoming Bitcoin halving scheduled for April 20, many are seeking alternative assets to diversify their portfolios. With ONDO demonstrating both resilience and growth, investors are left pondering whether it’s the right time to buy or sell. Let’s delve deeper into the analysis to determine the best course of action.
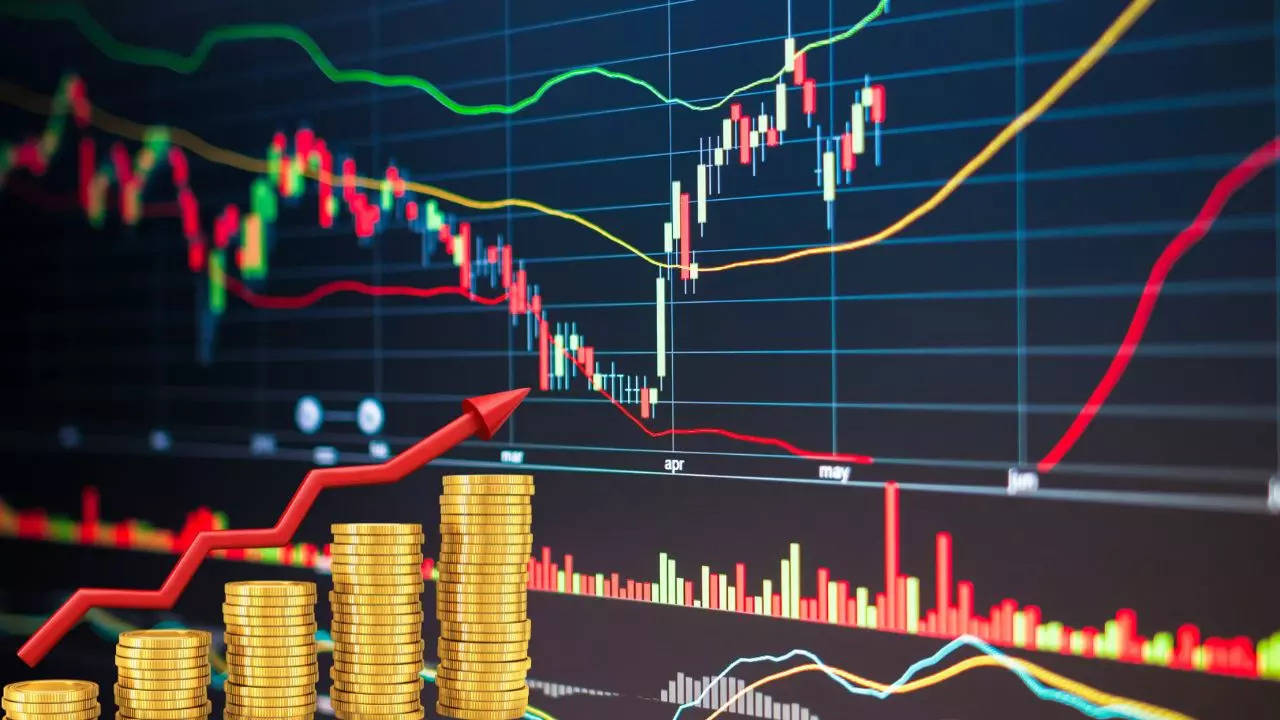
Market Performance and Price Analysis
Over the past 24 hours, ONDO has witnessed a price surge of 17.91 per cent, followed by a 15.79 per cent increase in the previous week and an impressive 87.28 per cent surge in the past month. These substantial price movements indicate heightened market interest and present potential investment opportunities for traders.
Currently ranked 70th, ONDO boasts a market capitalization of approximately $1.31 billion, with a trading volume to market cap ratio of 45.97 per cent, reflecting significant trading activity relative to its total market capitalization.
Out of the total 10 billion tokens available, ONDO has 1.38 billion tokens in circulation. Despite experiencing price fluctuations, ranging from a low of USD 0.7795 to a high of USD 1.02 in the last day, ONDO’s performance underscores the inherent volatility of the cryptocurrency market.
Technical Analysis and Market Outlook
Technical analysis of ONDO Finance reveals key indicators for both short-term and long-term perspectives:
– Both short-term and long-term moving averages signal a bullish sentiment, with Buy actions prevailing across various periods, indicating a positive price trend for ONDO Finance.
– The MACD Level signals a Buy action, further strengthening the optimistic outlook.
– The RSI stands at 60.84430, suggesting a neutral position, indicating neither overbought nor oversold conditions.
– Fibonacci support and resistance levels provide insights into potential price movements, with pivot points indicating a neutral stance at the current level.